TL;DR: Fire your Amazon PPC agency when it manages ACoS and spend instead of profit, and nobody ties ads to inventory, fees and returns. In this beauty brand case, net profit rose 29.9% in a year ($911,873.13 in 2023, $1,184,541.48 in 2024) after strategy moved in-house. ACoS settled near 19% and Ad ROAS near 5x.
Last reviewed: October 2026.
Should you fire your Amazon PPC agency?
Yes, if it optimizes for a number you cannot bank. An agency that reports ACoS, spend and impressions, but never contribution profit per SKU, is managing your dashboard, not your business.
Keep it if it already sets bids from SKU margin and works with you on inventory, fees and returns. Replace it if those four levers have no owner. Bringing PPC in-house only works when someone inside the company can own the P&L.
I first told this story on Medium as a straight case study. This version answers the question sellers actually ask me after reading it: how do I know when it is time to fire my own agency, and what do I do on day one?
The business is one beauty manufacturer, described in the original as 8-figure, that sold several brands on Amazon. Brand names are anonymized (Brand K, S, M, F, X and L). Every figure comes from Seller Central and Amazon Ads exports, and verification is available to qualified partners under NDA. I worked on this account through the move in-house, so where I say "we", I mean the in-house team.
I also wrote a version of this case for the BidVentor blog that walks the same story chronologically: why I would fire an Amazon PPC agency. Disclosure: I founded BidVentor, an Amazon advertising software company.
The case in one table
Here is what changed between the agency year (2023) and the in-house years. I only use numbers that appear in the account data.
| Metric | 2023 (agency) | 2024 (moving in-house) | 2025 (in-house, year to date) |
|---|---|---|---|
| Net profit | $911,873.13 | $1,184,541.48 (+29.9%) | $920,889.60 (Jan to Jul only) |
| ACoS, example months | 15.62% (Aug) to 37.20% (Sep) | 25.65% (Jan), 19.78% (Apr), 18.55% (Dec) | 17.48% (Feb) to 20.10% (Aug) |
| Ad ROAS, example months | 6.40x (Aug) to 2.69x (Sep) | 5.06x (Apr) | 4.98x (Aug) to 5.72x (Feb) |
| Organic share, example months | 82.5% (Apr), 42.7% (Jul), 41.0% (Sep) | 50.0% to 50.3% (Jan to Mar), 56.6% (Nov) | 57.9% (Apr), 44.3% (Jul) |
| Top brand share of profit | Brand K: 66.3% | Brand K and S both large | Brand S $460,555.06, Brand K $453,783.77 |
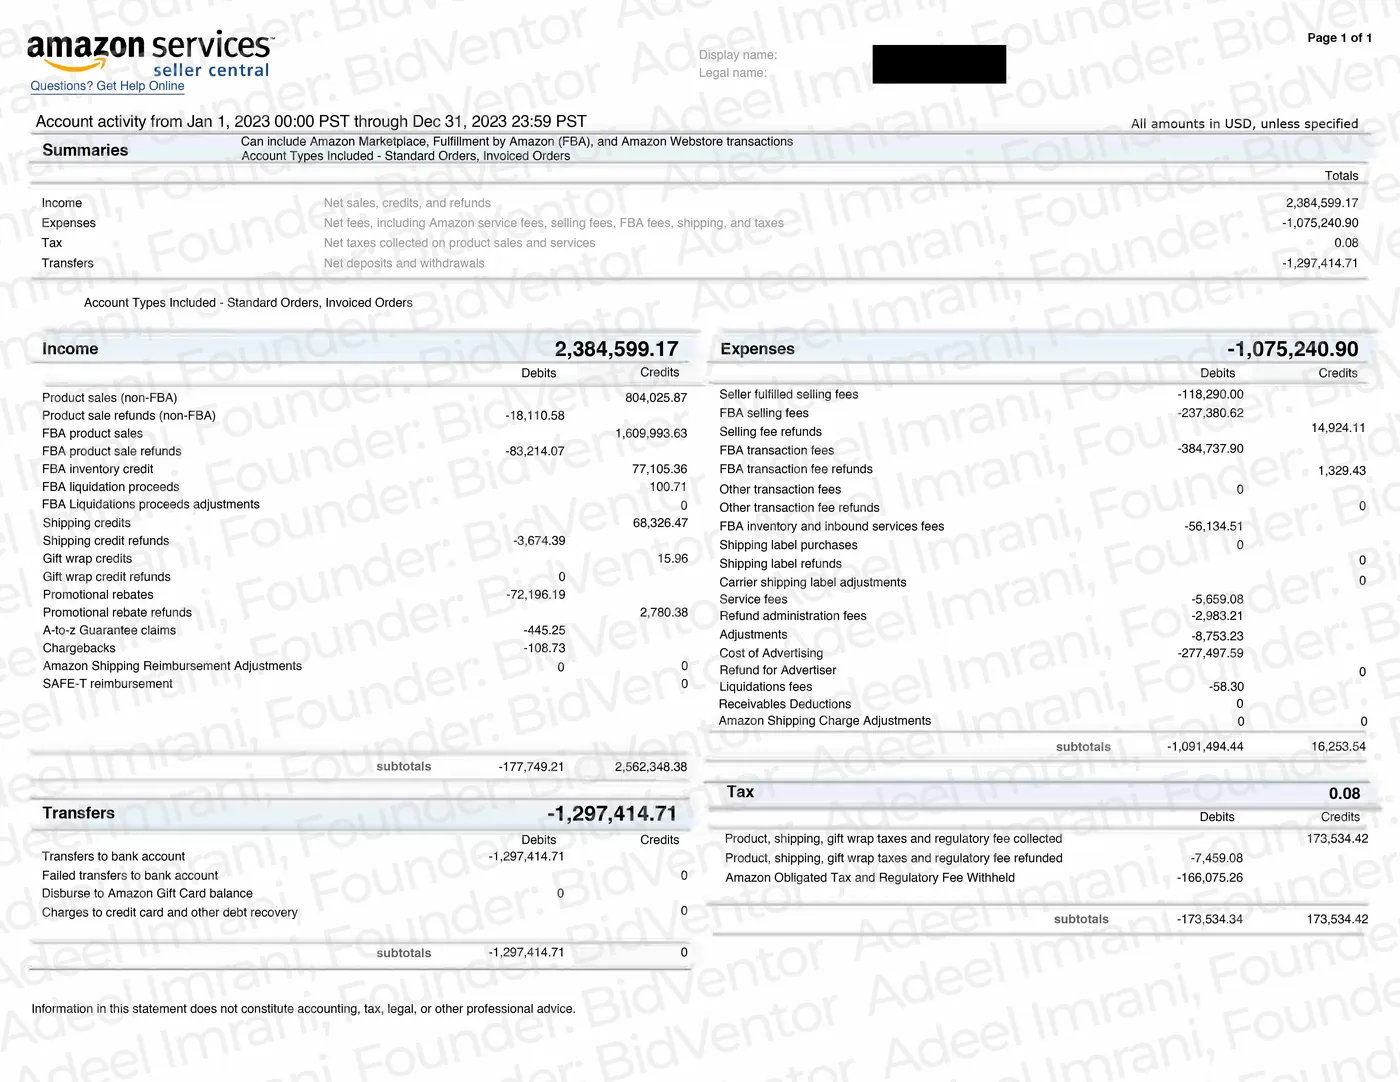
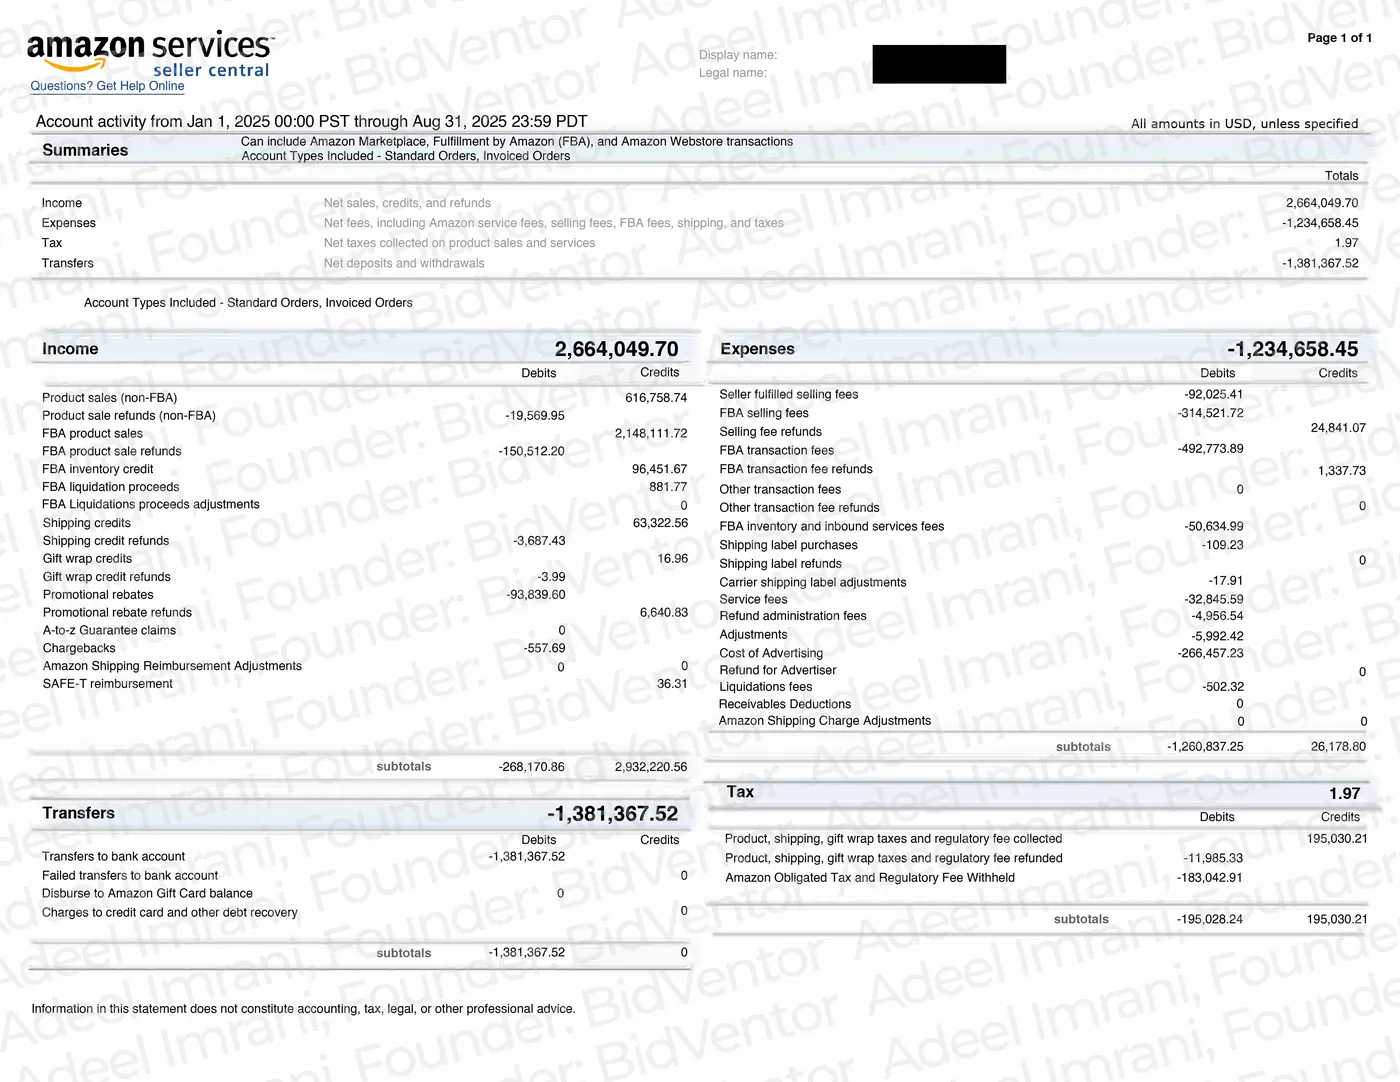
| Returns and adjustments bucket | ($338,537.59) | ($450,769.57) | ($297,051.56) |
Two things to notice. Profit grew 29.9% from 2023 to 2024, and ad efficiency stopped swinging. Not everything improved, though: the returns and adjustments bucket got bigger in dollars in 2024. I come back to that below, because an honest case study should show what did not get fixed.
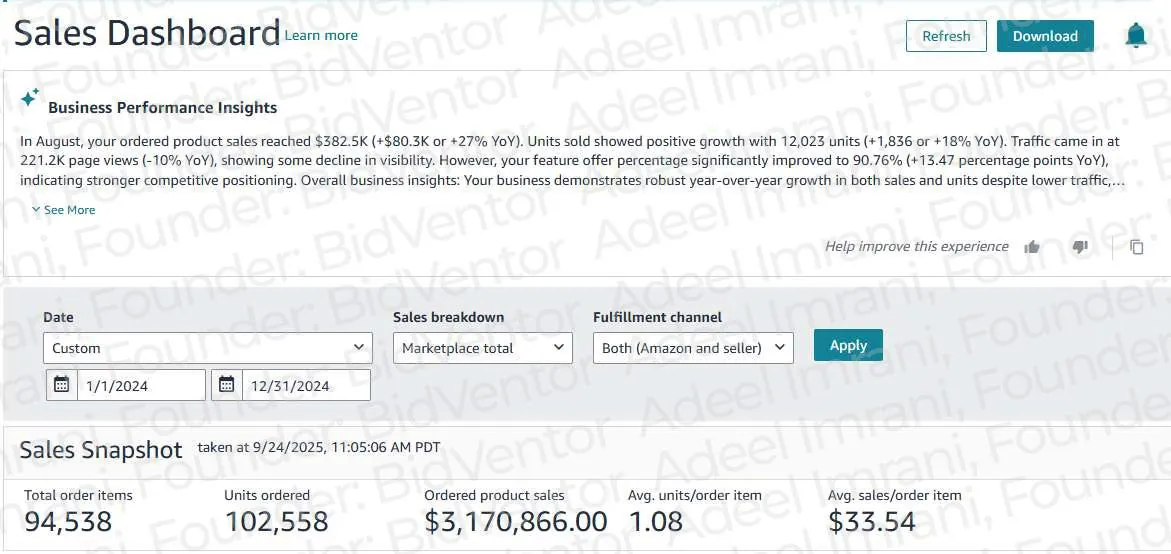
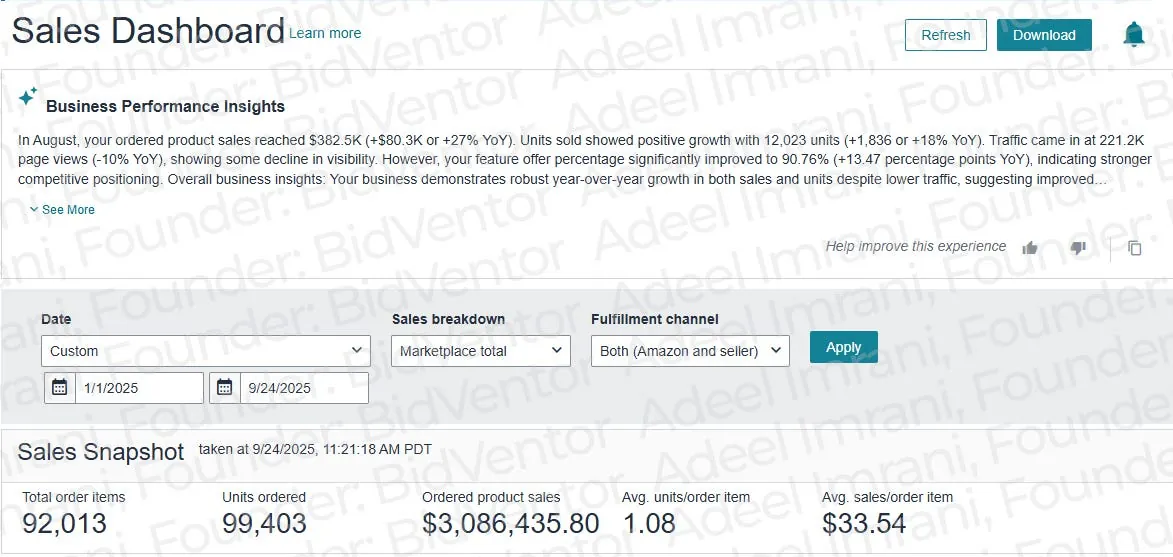
7 signs it is time to fire your Amazon PPC agency
Every one of these showed up in the 2023 data before the decision was made. If you recognize three or more in your own account, my rule of thumb is that the agency relationship needs to change, either in scope or in who runs it.
1. The report ends at ACoS
The agency's targets were ACoS numbers. Contribution margin never made it into the brief. ACoS tells you what ads cost relative to ad sales. It does not tell you whether a SKU made money after product cost, fees and returns. If your monthly report never shows profit per SKU, nobody is managing profit. The math to fix this is in my guide to the breakeven ACoS formula.
2. ACoS whipsaws from month to month
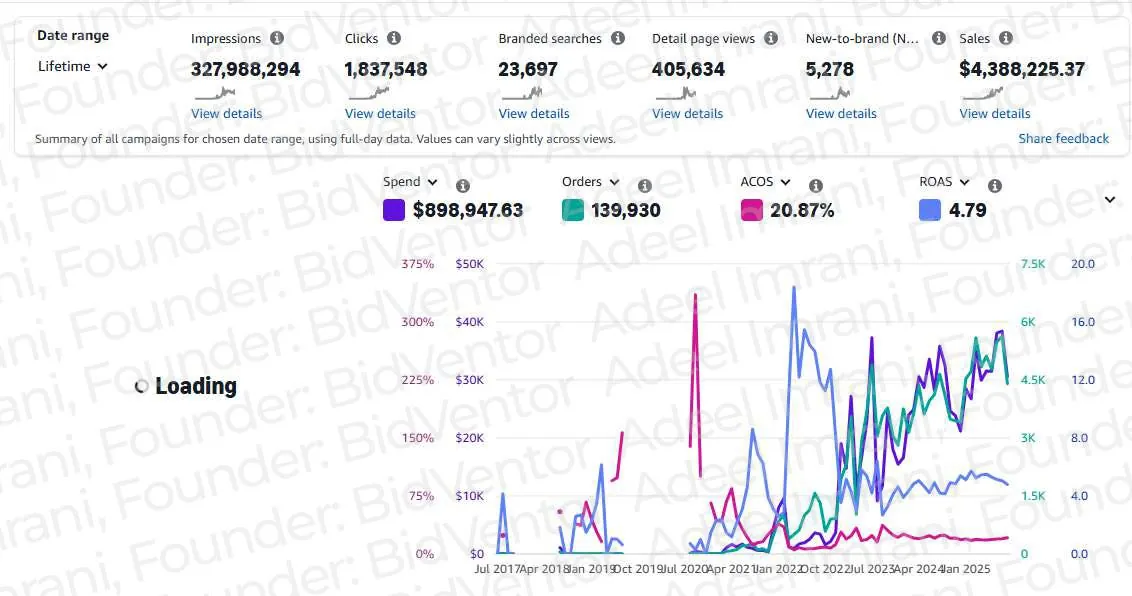
In August 2023 ACoS was 15.62%. In September 2023 it was 37.20%. Ad ROAS fell from 6.40x to 2.69x over the same two months. CTR ranged from 0.52% to 0.80%, and ad conversion rate had an April outlier of 2.18% against a typical 6% to 8%. Swings that size mean bids, budgets and inventory are not being managed as one system.
3. Organic share moves and nobody can explain why
Organic share is the part of total sales that did not come from ads: (total sales − ad sales) ÷ total sales. In 2023 that share was 82.5% in April, 42.7% in July and 41.0% in September, then recovered to 51% to 54% in Q4. When organic share halves in a quarter, you want an explanation. You rarely get one from an agency that only sees the ads console.
4. One brand carries the P&L
Brand K, the flagship haircare line, produced $604,196.00 of the $911,873.13 total net profit in 2023, which is 66.3%. Spend was not being allocated by portfolio risk. One bad quarter for Brand K would have hit the whole company.
5. Ads keep running into stockouts
Stockouts were quietly inflating ACoS and damaging rank. Ads and purchase orders were planned separately, so campaigns pushed traffic toward products that were about to run out. An agency that never asks about your inventory cover cannot fix this.
6. Fees, packaging and returns are "not our job"
The returns and adjustments line was ($338,537.59) in 2023. Product dimensions had never been audited against FBA fee tiers. None of this sits in the ads console, which is exactly why it gets ignored. Small packaging changes reduced fees per shipment, and those savings had been there for years.
7. The incentives reward more activity
Many agencies are paid on spend or on the work they can show: more campaigns, more keywords, more reports. At scale that model works against profitability. Ask yourself whether your agency would earn more or less if you spent less on ads and kept the same profit. If the answer is "less", the incentives are pointing the wrong way.
Amazon PPC agency vs in-house: what actually changes
Firing an agency is not the goal. The goal is that every lever that moves ad profit has one owner. This is how ownership shifted in this case.
| Lever | Under the agency | In-house |
|---|---|---|
| Bid targets | ACoS rules | Contribution per click and SKU margin, with TACoS and rank guardrails |
| Inventory | Not considered | Purchase orders matched to campaign cadence |
| FBA fees and packaging | Out of scope | Dimension audits, re-boxing, cartonization and inbound plans |
| Listings and creative | Visibility first | Image sequence, value per ounce, pack-size tests |
| Returns and adjustments | Out of scope | Treated as a product with an owner |
| Portfolio allocation | Per campaign | Per brand tier, like a portfolio manager |
When should you keep an agency? When you do not have anyone internally who can own the P&L and connect ads to operations. In that case, firing the agency just moves the same blind spots in-house. Change the brief before you change the vendor: ask for profit per SKU in every report and give the agency access to inventory and fee data.
How we brought Amazon PPC in-house, step by step
Late 2023: the decision
Leadership chose to end the agency arrangement and build an internal framework centered on profit, not spend. We did not start by scaling. We started by stopping the leaks.
Late 2023 to mid-2024: stop the leaks first
- Bid waste and match types. We cut broad and irrelevant search terms and moved budget into exact-match terms that were already converting.
- Bid ceilings from contribution. Each SKU got a maximum bid based on what it earns per click, replacing blanket ACoS rules.
- FBA fees and packaging. We measured every SKU and changed the box on those sitting just above an FBA fee tier.
- Inventory and ads in sync. Purchase orders were planned around campaign timing so we stopped advertising into stockouts.
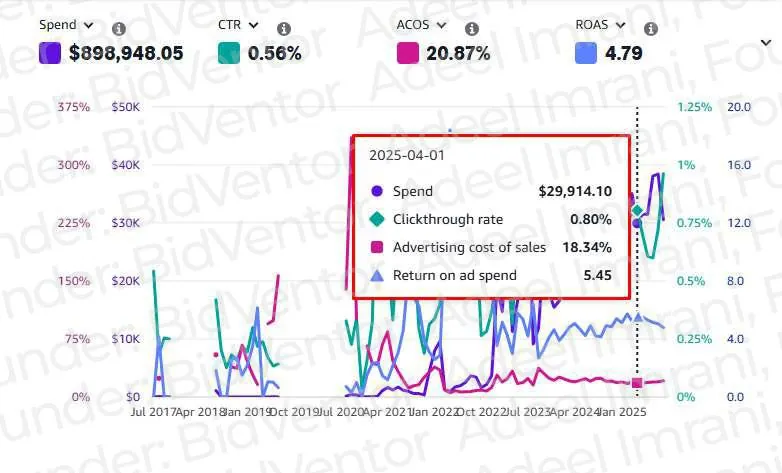
The early numbers moved quickly. In January 2024 ACoS was 25.65%. By April 2024 it was 19.78%, and Ad ROAS was 5.06x. Organic share held steady at 50.2%, 50.3% and 50.0% in January, February and March, and blended total ROAS was around 9x in April. That came from removing waste, not from new listings.
August 2024: full strategic control
In August 2024, full strategic control of Amazon operations moved to the in-house team. Four things changed:
- Profit-based bidding. Each target was derived from SKU margin and what a click contributes. Guardrails tied to TACoS and rank stopped us from winning auctions and losing the P&L.
- Conversion-first listings. We tested image order, value-per-ounce messaging and pack sizes to raise order value without promotions and conversion without coupons.
- Inventory orchestration. Order cadence matched the expected click and conversion curve, so campaigns never pushed into an empty shelf.
- Cost control as growth. Fee audits, cartonization and inbound plans. If it hits the P&L, I treat it like marketing.
A few weeks later ACoS was under 20% in key pushes, rank stabilized and the smaller brands started to matter.
What changed in the numbers
Profit
2023 net profit: $911,873.13. 2024 net profit: $1,184,541.48. That is +29.9%. January to July 2025 came in at $920,889.60. That is seven months, so it is not a like-for-like comparison with a full year, and I do not annualize it here.
Ad efficiency
2023 ACoS reached 30% to 37% in several months (37.20% in September, 30.50% in October). In 2024 it ran mostly in the low 20s and ended the year at 20.34% in October and 18.55% in December. In 2025 it held at roughly 18% to 20%: 17.48% in February, 18.88% in March, 18.18% in May, 19.45% in July and 20.10% in August. Ad ROAS stayed near 5x: 5.13x in January, 5.72x in February, 5.45x in April, 5.50x in May and 4.98x in August 2025.
Sales: the same months, two years apart
| Month | 2023 | 2025 | Change |
|---|---|---|---|
| January | $137,785.45 | $293,285.20 | +112.9% |
| February | $149,419.32 | $308,114.76 | +106.2% |
| March | $219,915.28 | $355,709.01 | +61.7% |
| April | $193,330.79 | $387,625.47 | +100.5% |
| May | $186,208.75 | $402,627.25 | +116.2% |
| June | $236,241.11 | $340,963.06 | +44.3% |
| July | $272,905.35 | $351,060.36 | +28.6% |
| August | $207,272.33 | $343,225.03 | +65.6% |
| January to August | $1,603,078.38 | $2,782,610.14 | +73.6% |
The total row is my own sum of the eight months above. Higher sales alone prove nothing; plenty of brands grow sales and lose profit, which is the Amazon profit paradox. What matters is that sales grew while ACoS came down and profit went up.
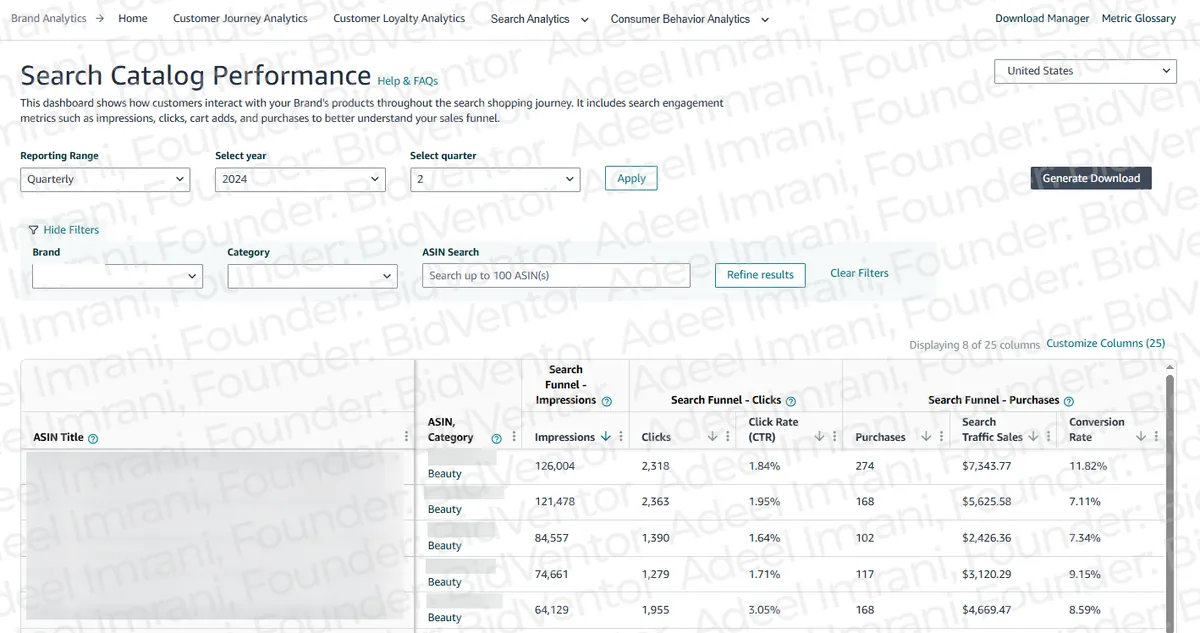
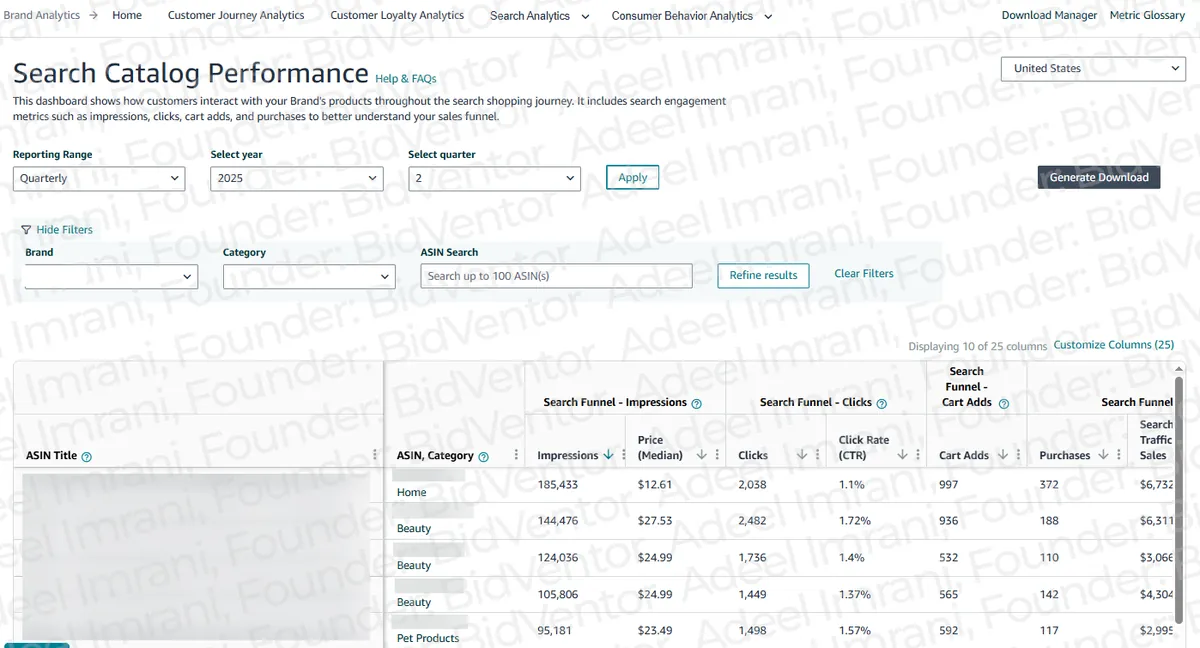
Organic share in the windows that mattered
- November 2024: $267,663.00 total, $116,170.10 from ads, $151,492.90 organic, so 56.6%.
- December 2024: $259,873.58 total, $114,140.82 from ads, $145,732.76 organic, so 56.1%.
- April 2025: $387,625.47 total, $163,123.77 from ads, $224,501.70 organic, so 57.9%.
- May 2025: $402,627.25 total, $173,498.35 from ads, $229,128.90 organic, so 56.9%.
From one engine to a portfolio
| Brand | 2023 | 2024 | 2025 YTD |
|---|---|---|---|
| K (haircare) | $604,196.00 | about $828K | $453,783.77 |
| S (spa consumables) | about $408K | about $522K | $460,555.06 |
| M (trend and styling) | $49,455.61 | $92,093.58 | $108,883.51 |
| F (foot care) | $53,155.71 | $58,804.88 | $69,997.86 |
| X (skincare) | $4,584.21 | $10,819.41 | $17,048.73 |
| L (luxury sub-brand) | $42,171.90 | $30,965.34 | $14,170.07 |
By 2025, Brand S and Brand K were co-leaders. That is a far safer business than one where a single brand earns two thirds of the profit. Brand M, F and X all grew from 2023, which gave the in-house team room to move budget between tiers instead of defending one hero.
What going in-house did not fix
Case studies that only show green arrows are hard to trust. Three things did not simply improve.
Organic share dipped in peak months, on purpose
In July 2025 organic share was 44.3% ($351,060.36 total, $195,564.01 from ads, $155,496.35 organic) and in August it was 44.2%. We accepted that because ACoS stayed efficient (19.45% in July, 20.10% in August) and ROAS was near 5x. Paid traffic was pulling demand forward and defending rank while the math still worked. The goal is maximum profit, not maximum organic share.
The returns and adjustments bucket stayed large
Returns, refunds, adjustments and reserve mechanics showed up as a large negative line every year: ($338,537.59) in 2023, ($450,769.57) in 2024 and ($297,051.56) in 2025 year to date. The dollar figure grew in 2024. We treated it as a product with an owner: listing copy that sets fit and usage expectations, a plain "who this is not for" line, packaging QA to cut damages, removing confusing variations, and support macros that turn refund requests into exchanges where that makes sense. At this scale it is six figures a year, so it deserves the same attention as ad spend.
One brand got smaller, deliberately
Brand L went from $42,171.90 in 2023 to $30,965.34 in 2024 and $14,170.07 in 2025 year to date. We chose to throttle it because category fees kept squeezing it, replenishment was slower and its ceiling was lower, and moved budget to Brand M, X and F, where each click was earning more. Cutting a line is a growth decision too.
Your first 90 days without an agency
If you decide to bring Amazon PPC in-house, this is the order I would follow.
- Map profit by brand and SKU. Profit, not revenue, every quarter. Find your own "Brand K" and decide what your second engine is. If you need benchmarks, start with what a good profit margin on Amazon looks like.
- Set profit targets, then back into ACoS. Work out target CPC and target ACoS from SKU contribution margin, not the other way round. Rank your top 20 search terms by contribution.
- Ladder campaigns by intent. Three layers: defend your own brand and core keywords; harvest with close-match and product targeting; expand into category and competitor terms last. Protect the defend layer and demand the most from expand spend.
- Give every avoidable cost an owner. Fees, damages and returns each get a target. Audit dimensions every quarter, and rewrite listings to remove the three most common return reasons.
- Order inventory for the rank you want. Plan the three months before Q4 now. A stockout during a push is a negative ad return in disguise.
None of this needs a new tool on day one. It needs someone who reads the P&L and the ads console together.
Key takeaways
- Fire your Amazon PPC agency when it manages ACoS and spend instead of profit per SKU, and nobody owns inventory, fees and returns.
- Net profit in this case grew 29.9% year over year, $911,873.13 (2023) to $1,184,541.48 (2024).
- ACoS stopped swinging between 15% and 37% and held at roughly 18% to 20%, with Ad ROAS near 5x.
- Stabilize first, then scale. The early gains came from cutting waste, fixing packaging and syncing inventory.
- Not everything improved: the returns and adjustments bucket stayed large, and organic share dipped in peak months by choice.
Frequently asked questions
Should I fire my Amazon PPC agency?
Fire it when it manages to a metric you cannot bank, such as ACoS, spend or impressions, and nobody connects ads to SKU margin, inventory, fees and returns. If your agency already reports contribution profit per SKU and owns those levers, the problem is probably elsewhere.
What are the signs an Amazon PPC agency is not working?
Reports that stop at ACoS, ACoS that swings by 20 points between months, organic share that moves without explanation, one brand carrying most of the profit, ads that keep running into stockouts, and nobody owning fees, packaging or returns. In the case study, ACoS was 15.62% in August 2023 and 37.20% a month later.
How much did profit grow after moving Amazon PPC in-house?
2023 net profit was $911,873.13 and 2024 net profit was $1,184,541.48, a 29.9% increase. For January to July 2025 it was $920,889.60. Those are seven months, so do not compare that figure directly with a full year.
What happened to ACoS and ROAS after the agency was gone?
ACoS was 25.65% in January 2024 and 19.78% by April 2024, when Ad ROAS reached 5.06x. Through 2025 it ran at roughly 18% to 20%, for example 17.48% in February and 20.10% in August, and Ad ROAS stayed near 5x.
How long does it take to bring Amazon PPC in-house?
In this case the decision came in late 2023, ACoS was below 20% by April 2024, and full strategic control moved to the in-house team in August 2024. Plan for a stabilization phase of a few months before you try to scale.
Is bringing Amazon PPC in-house right for every brand?
No. It works when someone inside the business can own the P&L and connect ads with inventory, fees, listings and returns. Without that person, firing the agency just moves the same problems in-house.
How do you calculate organic share on Amazon?
Organic share = (total sales − ad sales) ÷ total sales. In April 2025 the brand had $387,625.47 of total sales and $163,123.77 of ad sales, so $224,501.70 was organic, or 57.9% of the total.
What should I do in the first 90 days without an agency?
Map profit by brand and SKU, rank your top 20 search terms by contribution instead of ACoS, give each avoidable cost (fees, damages, returns) a target and an owner, rewrite listings to remove the top reasons for returns, and order inventory for the rank you want next quarter.
Sources
All figures come from the brand's Seller Central and Amazon Ads data as published in the original case study. Brand names are anonymized. Percentage changes and the January to August totals are my own arithmetic on those figures.
- Adeel Imrani on Medium: the original case study (Nov 8, 2025)
- BidVentor blog: the chronological version of this case study (I founded BidVentor)
Not sure whether your agency is the problem?
If you want a second opinion on your ad account and P&L before you make the call, book an audit. You can also read more about me first.