Short answer: A good net profit margin for a beauty brand on Amazon is roughly 15% to 25%, the range Amazon's own seller blog lists as a general estimate, measured after fees, ads, returns and overhead. In the $100 example below, $100 of sales leaves $16.80 of net profit. Track gross, contribution and net margin separately.
Last reviewed: October 2026. Fees and benchmarks checked October 27, 2026.
Ask ten Amazon sellers what a good margin is and you will get ten numbers, because they are measuring ten different things. One person means gross margin. Another means what is left after ads. A third means what reaches the bank after the team is paid.
This guide fixes that. It defines the three margins, compares published benchmarks and explains why they disagree. It then follows $100 of beauty sales line by line to a net profit figure, with an editable calculator so you can replace my example with your own costs. Every "example" number is an illustrative assumption, not a benchmark and not anyone's actual result.
What is a good profit margin on Amazon for beauty brands?
Amazon's own seller blog (page dated July 27, 2026) puts typical beauty and personal care margins at 60% to 80% gross and 15% to 25% net. It labels these as general industry estimates based on public data, and it notes that many ecommerce businesses aim for 10% to 20% net.
My working rule, which is a judgment and not a published benchmark:
- Under 10% net: fragile. One fee change, one slow quarter or one bad ad month can erase it.
- 10% to 15% net: workable if the trend is stable and cash is not tied up in slow stock.
- 15% to 25% net: healthy for an established beauty brand with real overhead.
- Above 25% net: check whether you are under-investing in ads or people, or whether overhead is simply not counted.
The number only means something if you know which margin it is. That brings us to definitions.
What is the difference between gross, contribution and net margin?
Each margin answers a different question. Using all three stops a healthy gross margin from hiding an unprofitable business.
| Margin | What it subtracts from sales | Question it answers | In the $100 example |
|---|---|---|---|
| Gross margin | Landed product cost only | Is the product priced well? | 73.0% |
| Margin before ads | Returns, product, Amazon fees, storage, write-offs, coupons | How much can I spend on ads? | 35.8% |
| Contribution margin | All of the above plus advertising | Does each sale pay for itself? | 22.8% |
| Net margin | Contribution costs plus overhead (software, team, agency) | What do I actually keep? | 16.8% |
Amazon's blog defines gross margin as sales minus cost of goods sold (COGS), and net margin as profit after all expenses. This guide splits the middle into "before ads" and "contribution" because ads are the cost sellers control most. Taxes and interest sit below these lines and vary by entity, so the example stops before them.
What do published benchmarks say about Amazon profit margins?
Published numbers disagree. The table lists four sources, with what each one measured.
| Source (date) | Segment | Reported margin | Caveat |
|---|---|---|---|
| Amazon seller blog (Jul 27, 2026) | Beauty and personal care | 15% to 25% net; 60% to 80% gross | Labelled "general industry estimates"; no method given |
| Jungle Scout survey (fielded Dec 2023 to Jan 2024) | All categories, small and mid-size sellers | 57% above 10%; 28% above 20%; 13% not profitable | Self-reported, all categories, 2024 data |
| EconKit (Apr 9, 2026) | Health and personal care | 18% to 30% net | "Compiled from public surveys" without links; private-label FBA sellers |
| Nova Analytics (updated Oct 8, 2026) | Beauty and personal care | 28% to 35% "avg margin"; private label "good" 25% to 35% net | Software vendor; no method given |
Why are the ranges so far apart?
Four reasons, and none of the sources lets you settle them:
- Definitions differ. Some figures are gross, some are net of ads, and some leave out overhead.
- Seller types differ. Private-label sellers with one hero SKU look different from brands with a team, retail accounts and several channels.
- Methods are undisclosed. Vendor benchmarks rarely show their sample or how margins were calculated.
- Self-reporting flatters. Sellers who skip returns, write-offs or their own time report higher margins than the bank statement shows.
So treat any single benchmark as a rough range. The better test is whether your own margin reconciles to the cash that arrives in your bank account.
Where does each dollar of a $100 beauty sale go?
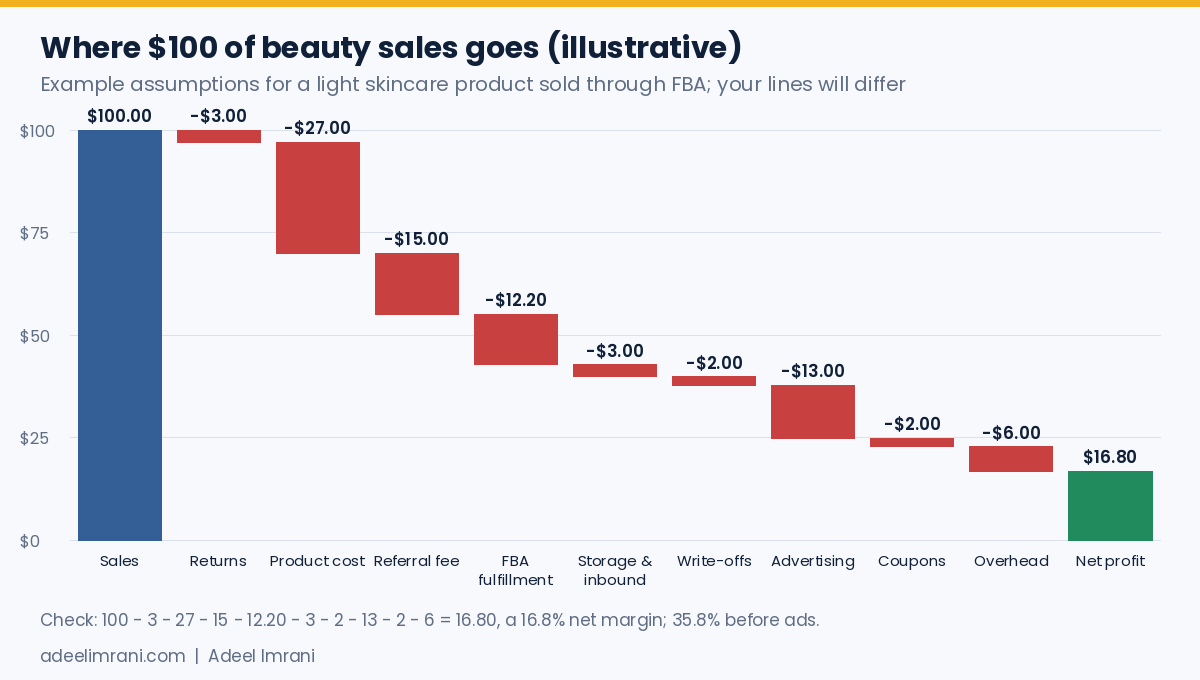
The waterfall below follows $100 of sales through each cost, in the order a seller meets them. Every line is an example assumption for a light, small-size skincare product sold through FBA. Your lines will differ.
| Line | Cost per $100 | Balance left |
|---|---|---|
| Gross sales | n/a | $100.00 |
| Returns and unsellable units | −$3.00 | $97.00 |
| Landed product cost (COGS) | −$27.00 | $70.00 |
| Amazon referral fee (15%) | −$15.00 | $55.00 |
| FBA fulfillment | −$12.20 | $42.80 |
| Storage, inbound and removals | −$3.00 | $39.80 |
| Expiry, aged and hazmat write-offs | −$2.00 | $37.80 |
| Advertising (13% of total sales) | −$13.00 | $24.80 |
| Coupons and promotions | −$2.00 | $22.80 |
| Software, team and agency overhead | −$6.00 | $16.80 |
The checks: $97.00 − $27.00 = $70.00. Less the $15.00 referral fee is $55.00, and less $12.20 FBA is $42.80. After storage ($3.00) and write-offs ($2.00) that is $37.80. Ads take it to $24.80, coupons to $22.80, and overhead to $16.80, a 16.8% net margin. Adding the ads back gives a 35.8% margin before ads.
What do Amazon's fees look like in this example?
Amazon's current pricing page lists a 15% referral fee for beauty, health and personal care items above $10, and 8% at or below $10, with a $0.30 minimum. The Professional plan costs $39.99 a month. For a $30 item the 15% fee is $4.50. FBA fulfillment is a per-unit fee, and Amazon's 2026 fee letter sets the rates. A 3.5% fuel and logistics surcharge has applied since April 17, 2026, according to CNBC's report. Supply Chain Dive reports peak-season fulfillment fees from Oct 15, 2026 to Jan 14, 2027, so Q4 lines run higher.
Referral plus FBA in the example is 27.2% of price, or 30.2% with storage and inbound. That is the cost of the channel before a single ad runs. My channel comparison shows how these lines change on Walmart, TikTok Shop and Shopify.
Profit waterfall calculator (editable)
Enter your own monthly sales and each cost as dollars per $100 of sales. Results update as you type. The defaults are the example above and they still show if JavaScript is off.
$100 profit waterfall calculator
The last two rows treat a sale driven by ads as carrying the same cost stack as the rest, then subtract the test ACoS in place of the blended ad line. The 19.78% default is the final ACoS reported in the Hair Care case study, applied here to the example cost stack for illustration only.
How can sales grow 40% while profit falls?
This is the pattern behind my Amazon profit paradox post. In the example below, Month B sells 40% more than Month A, yet earns about 27% less. Both months use example figures. The assumption is that pushing for volume raises ad, storage, write-off, coupon and overhead costs faster than sales.
| Line | Month A | Month B |
|---|---|---|
| Sales | $100,000 | $140,000 |
| Returns and unsellable units | $3,000 | $4,200 |
| Landed product cost | $27,000 | $37,800 |
| Referral fee | $15,000 | $21,000 |
| FBA fulfillment | $12,200 | $17,080 |
| Storage, inbound, removals | $3,000 | $5,600 |
| Write-offs | $2,000 | $4,200 |
| Advertising | $13,000 | $23,800 |
| Coupons and promotions | $2,000 | $4,200 |
| Overhead | $6,000 | $9,800 |
| Net profit | $16,800 (16.8%) | $12,320 (8.8%) |
Month B's ad spend rose 83% ($13,000 to $23,800) against 40% more sales, so ads went from 13% to 17% of sales. Storage and write-offs rose from 5% to 7% of sales as more inventory sat unsold. Profit fell by $4,480, or 26.7%.
The lesson is not "don't grow". It is that each extra dollar of sales has to clear its own cost stack. If you only watch revenue, Month B looks like a win.
How much advertising can this margin afford?
Your margin before ads is the ceiling for ad spend on an order. In the example it is 35.8%. Overhead still has to be paid, so the real ceiling is lower.
Worked example: if an ad-driven order carries the same costs and the ad costs 19.78% of its sales (ACoS), then 35.8% − 19.78% = 16.02% remains before overhead. After the 6% overhead line, 10.02% remains. That is positive, but thin compared with the 16.8% blended net, because ads that win new customers can cost more than the blended ad line.
Managing that ad line account-wide is the job of BidVentor's Amazon PPC tool, which I built. Disclosure: I'm the founder of BidVentor.
For a real figure, the Hair Care brand turnaround case study reports a final ACoS of 19.78%. I use it here only as an illustration of the ACoS scale. It does not describe the example cost stack, and no margin result should be read from it. Breakeven ACoS, target ACoS and TACoS have their own guide: breakeven ACoS, target ACoS and TACoS. Amazon's Ads guide gives the formula as ad spend divided by ad revenue, times 100.
How do you calculate your real Amazon margin from your reports?
You do not need new software to start. You need a monthly tie-out between three sources and your bank statement.
- Pull sales and units from Business Reports for the month, by SKU where you can.
- Pull fees, refunds and reimbursements from Amazon's payments or settlement reports. This is where referral, FBA, storage, removals and returns appear.
- Pull ad spend from the advertising console and check it matches the ad charges in the settlement data.
- Add what Amazon does not show: landed cost of units sold, write-offs for expired or destroyed stock, coupons you fund, software, team and agency fees.
- Convert each line to cents per dollar of sales and compare to the waterfall above.
- Reconcile to the bank. Amazon payouts less your inventory payments should tell the same story as your profit figure. A big gap means a missing cost or a timing issue.
Amazon's 2026 fee letter points sellers to a Profit Analytics dashboard and a Fee and Economics Preview report. Check what your account provides, but keep the reconciliation to your own bank, because dashboards may not include landed cost, overhead or write-offs.
Which levers raise margin first?
The table shows the effect of one change at a time on the example. Effort ratings are my judgment.
| Lever | Example change | Net margin effect | Effort |
|---|---|---|---|
| Trim wasted ad spend | Ads 13 to 11 per $100 | 16.8% to 18.8% | Medium |
| Renegotiate landed cost by 5% | COGS 27.00 to 25.65 | 16.8% to 18.15% | Medium to high |
| Cut expiry and aged write-offs | 2 to 1 per $100 | 16.8% to 17.8% | Medium |
| Trim storage, inbound and removals | 3 to 2 per $100 | 16.8% to 17.8% | Medium |
| Reduce returns | 3 to 2 per $100 | 16.8% to 17.8% | Medium |
| Tighten overhead | 6 to 5 per $100 | 16.8% to 17.8% | Low to medium |
Ads and landed cost usually move the most. Write-offs often hide in plain sight for beauty brands, because product with a shelf life becomes unsellable. See Amazon expiration date requirements for beauty and, for restricted products, whether nail polish counts as hazmat on FBA.
Returns and weak ratings also cut into margin, and customer reviews are where buyers explain why. Review analysis for Amazon listings from BidVentor reads the reviews on a listing, so you can see what buyers praise and what they complain about before you change the product or the page.
How do you know if growth is lowering your profit?
- Calculate net margin for the last three months, using the steps above.
- Compare ad spend, storage and write-offs as a percent of sales, not in dollars.
- If sales rose and any of those percentages rose with them, profit per dollar of sales is shrinking. Find the SKU or campaign causing it before adding more volume.
Key takeaways
- Amazon's seller blog lists 15% to 25% net as typical for beauty, as a general estimate.
- Always say which margin you mean: gross, before ads, contribution or net.
- In the $100 example, 73.0% gross becomes 16.8% net after fees, ads and overhead.
- Margin before ads (35.8% in the example) is your ad-spend ceiling.
- Revenue can rise 40% while profit falls if costs grow faster than sales.
- Reconcile your margin to your bank statement every month.
- All "example" numbers here are assumptions. Replace them with your own.
Frequently asked questions
What is a good profit margin on Amazon?
Amazon's seller blog says many ecommerce businesses aim for 10% to 20% net and lists 15% to 25% as typical for beauty and personal care, both as general estimates. Measure it after fees, ads, returns and overhead. Under 10% is fragile; above 25% deserves a check for uncounted costs.
What is the average Amazon FBA profit margin?
There is no single reliable average. Jungle Scout's 2024 survey of small and mid-size sellers found 57% reporting margins above 10%, 28% above 20% and 13% not yet profitable. It is self-reported and spans all categories, so treat it as a rough guide, not a target for your brand.
What is a good profit margin for beauty products on Amazon?
Amazon lists 15% to 25% net for beauty and personal care. Vendors publish higher figures, such as 28% to 35% from Nova and 18% to 30% from EconKit for health and personal care. The gap comes from definitions and sample. I would plan around 15% to 25% net.
How do I calculate my profit margin on Amazon?
Divide net profit by sales. Net profit is sales minus returns, landed cost, Amazon fees, storage, write-offs, coupons, advertising and overhead. In the example, $100 of sales minus $83.20 of costs leaves $16.80, or 16.8%. Use the calculator above and reconcile the result to your bank account.
What percentage does Amazon take from sellers?
For beauty items above $10 the referral fee is 15% (8% at or below $10, with a $0.30 minimum). FBA fulfillment, storage and any surcharge come on top. In the example, referral plus FBA is 27.2% of price, or 30.2% with storage. Ads and returns are extra.
Is selling beauty products on Amazon still profitable?
It can be, but it depends on your cost stack. The example earns 16.8% net, which sits inside Amazon's 15% to 25% estimate, yet falls to 8.8% when ads, storage and write-offs grow faster than sales. Profit depends on controlling those lines, not only on selling more.
What is the difference between gross, contribution and net margin?
Gross margin subtracts product cost only (73.0% in the example). Contribution margin also subtracts Amazon fees, returns, write-offs, coupons and ads (22.8%). Net margin subtracts overhead too (16.8%). Gross shows pricing health, contribution shows whether each sale pays for itself, and net shows what you keep.
Where to go next
If you would like this waterfall built on your real statements, with returns, ads, write-offs and overhead tied to your bank deposits, that is what a profit audit does. You can read about my background and see case studies first. When you are ready, book an audit.
Sources
All pages checked October 27, 2026.
- Amazon: profit margin calculator and category estimates (Jul 27, 2026)
- Amazon: Sell on Amazon pricing and referral fees
- Amazon Selling Partners: 2026 US referral and FBA fee update
- CNBC: Amazon 3.5% fuel and logistics surcharge for sellers
- Supply Chain Dive: Amazon 2026 holiday fulfillment fees
- Amazon Ads: ACOS guide
- Jungle Scout: how much Amazon sellers make (2024 survey, third party)
- EconKit: Amazon profit margins by category, 2026 (third party)
- Nova Analytics: FBA profit margins 2026 (third party)